
The Movie Industry from 1980 to 2020
Analyzing Budgets, Revenues, Directors, and Stars with Python


The movie industry has been a beloved source of entertainment for decades, with a global revenue of approximately 11.9 billion U.S. dollars in 2020 (according to Statista). In this blog post, I will analyze a dataset coming from Kaggle with a total of 7,512 movies from 1980 to 2020, the data was scraped from IMDb, to explore the correlations between budgets, revenues, directors, and stars. I will use Python with Pandas, Seaborn, Matplotlib, and Numpy libraries to manipulate and visualize the data. If you would like to check the code repository, please click here.
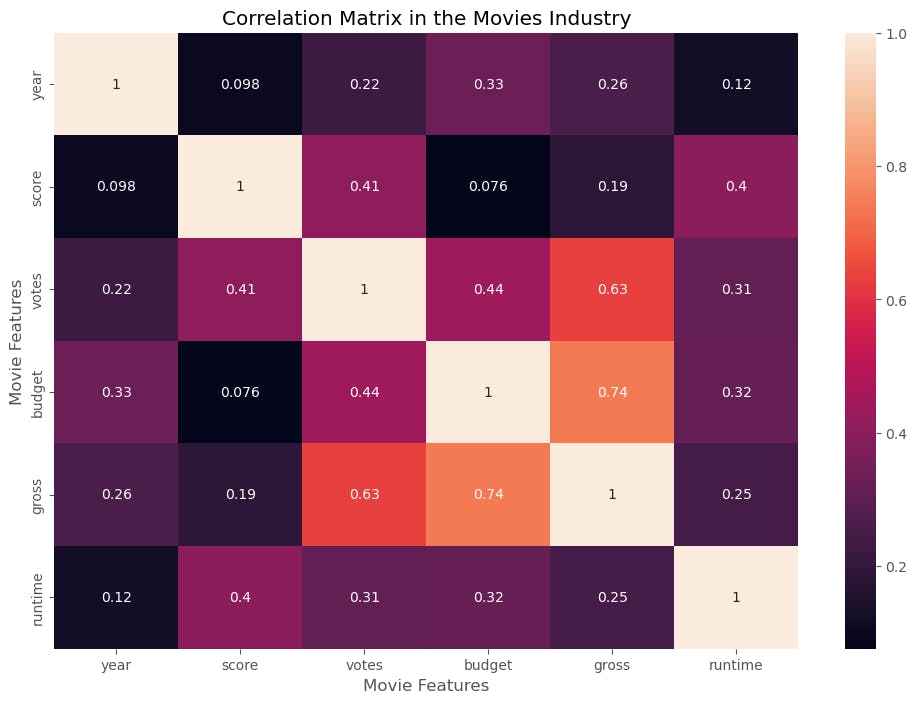
To begin, I will use the Pearson method to measure the correlation between different variables such as Budget, Gross Revenue, year, score (IMDb user rating), votes (# audience votes), and runtime (duration of movie). Correlation is a statistical method used to measure the strength and the direction of two variables, ie: Budget and Gross Revenue. There are numerous methods to correlate data, in this case, we are using the Pearson method. To measure ranges from -1 ( Perfectly Negative Correlation) and 1 ( Perfectly Positive Correlation).
Perfect positive correlation translates to as one variable increases, the second variable tends to increase as well. As we see in the below image, the squares with the lightest colors represent the variables that have a higher correlation. As shown in the heatmap, the strongest correlation (0.74) is between Budget and Gross Revenue, meaning that movies with larger budgets tend to generate higher revenue. Another interesting finding is the positive correlation (0.63) between votes and gross revenue, indicating that popular movies with high audience ratings tend to generate more revenue. Some other interesting correlations in this heatmap are budget and votes with a (0.44) correlation.
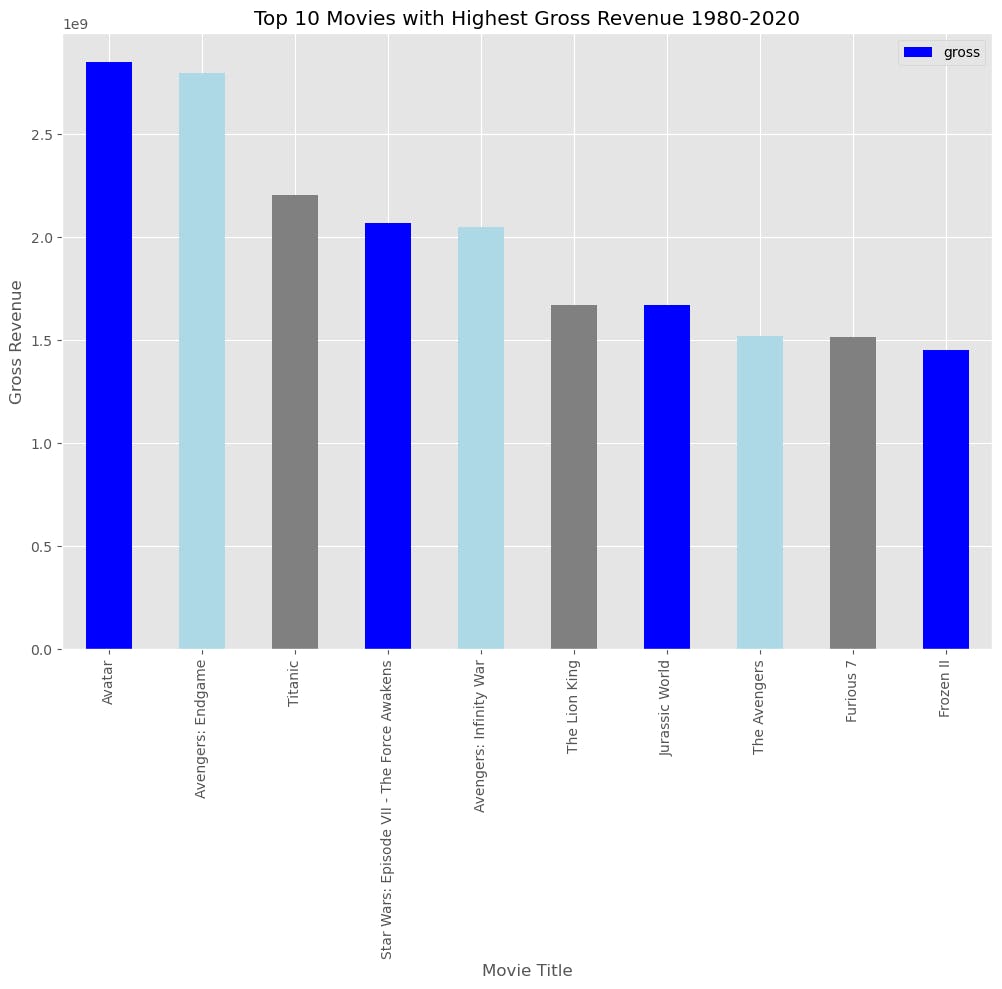
Now, let's look at the Highest Gross Revenue movies between 1980 - 2020. The old classics are here: Avatar with revenue of over $2.8 USD million dollars, Avengers: Endgame with $2.7 USD million of dollars, Titanic with 2.2 USD million of dollars, Star Wars: Episode VII - The Force Awakens with $2.0 USD million of dollars, Avengers: Infinity War with also $2.0 USD million of dollars placing them in the top 5.
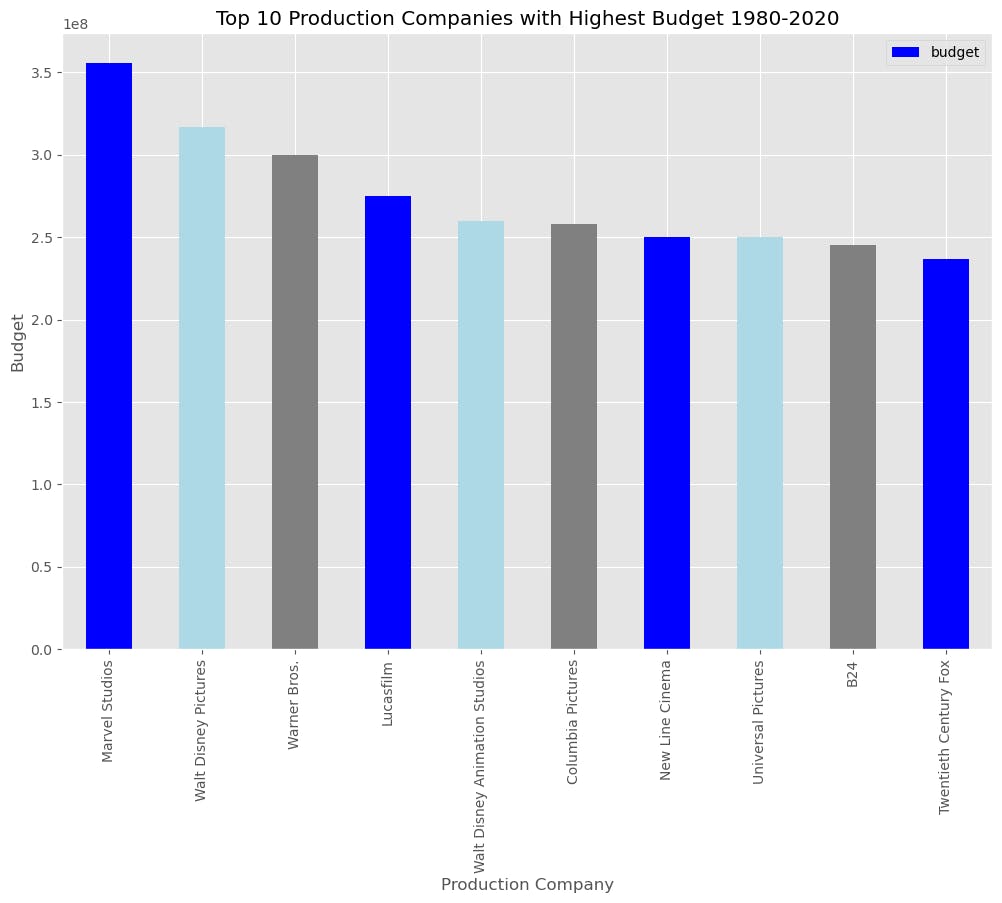
Moving on, I will examine the top 10 production companies with the highest movie budgets. Not surprisingly, Marvel Studios is on the top with the highest investment in movies just over $3.5 USD million of dollars, followed by Walt Disney Pictures with over $3.2 USD million of dollars, Warner Bross with $3.0 USD million of dollars, Lucasfilm with over $2.8 USD million of dollars, Walt Disney Animation Studios with over $2.6 USD million of dollars, and Columbia Pictures with 2.5 USD million of dollars.
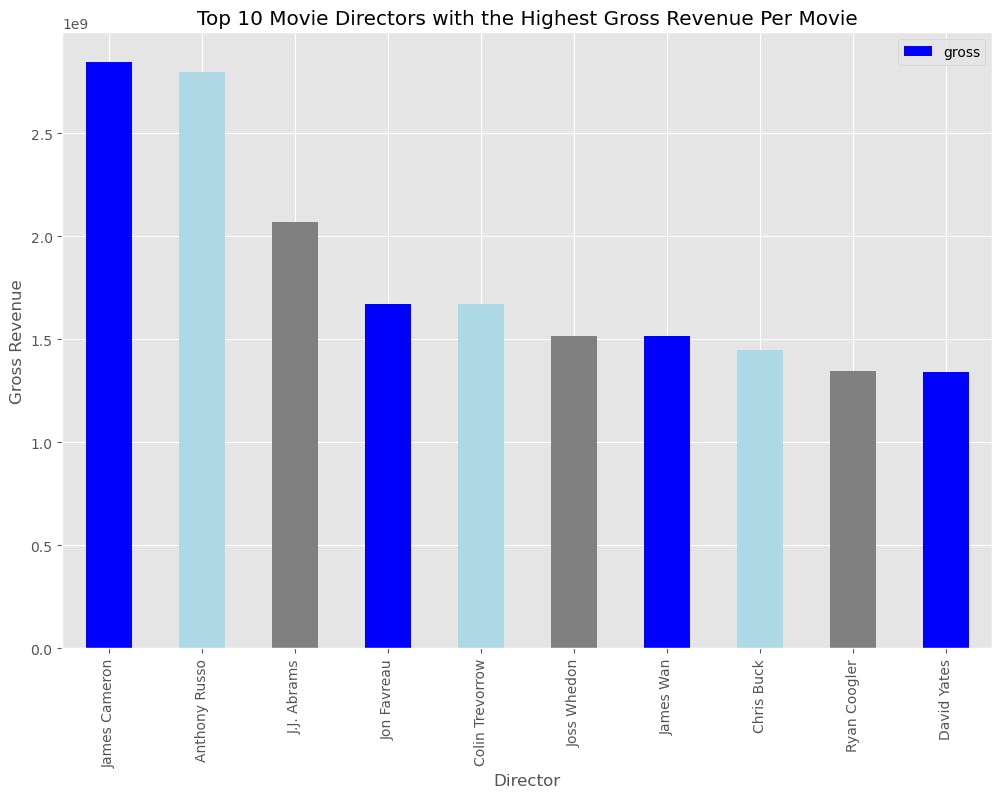
Almost getting to the end of this analysis, I wanted to check which movie directors were in the top 10 with the highest gross revenue per movie. We found James Cameron at the top, followed by Anthony Russo, J.J. Abrams, Jon Favreau, and Colin Trevorrow among others.
And finally, what about the stars? Those who through pure talent make good movies part of history. Who are those stars who made from the movies the top 10 highest revenues between 1980 and 2020? Sam Worthington is in the top one, Robert Downey Jr in second place, Leonardo Dicaprio in the third place, Daisy Ridley in the fourth place, and Donald Glover in the fifth place among others.

Overall, the movie industry is a dynamic and constantly evolving industry, and analyzing data is crucial for informed decision-making. By using tools like Python, SQL, and Excel, companies can gain insights into audience preferences, market trends, and revenue potential.
I hope this analysis has provided valuable insights into the movie industry from 1980 to 2020.